Power Platform: News and Highlights
Microsoft’s Power Platform combines powerful services under one umbrella: Power BI, Power Apps and Power Automate have many fans worldwide because they make it easier to analyse and control processes. To keep the software useful, Microsoft is constantly updating it. We present the most important current and upcoming highlights here.
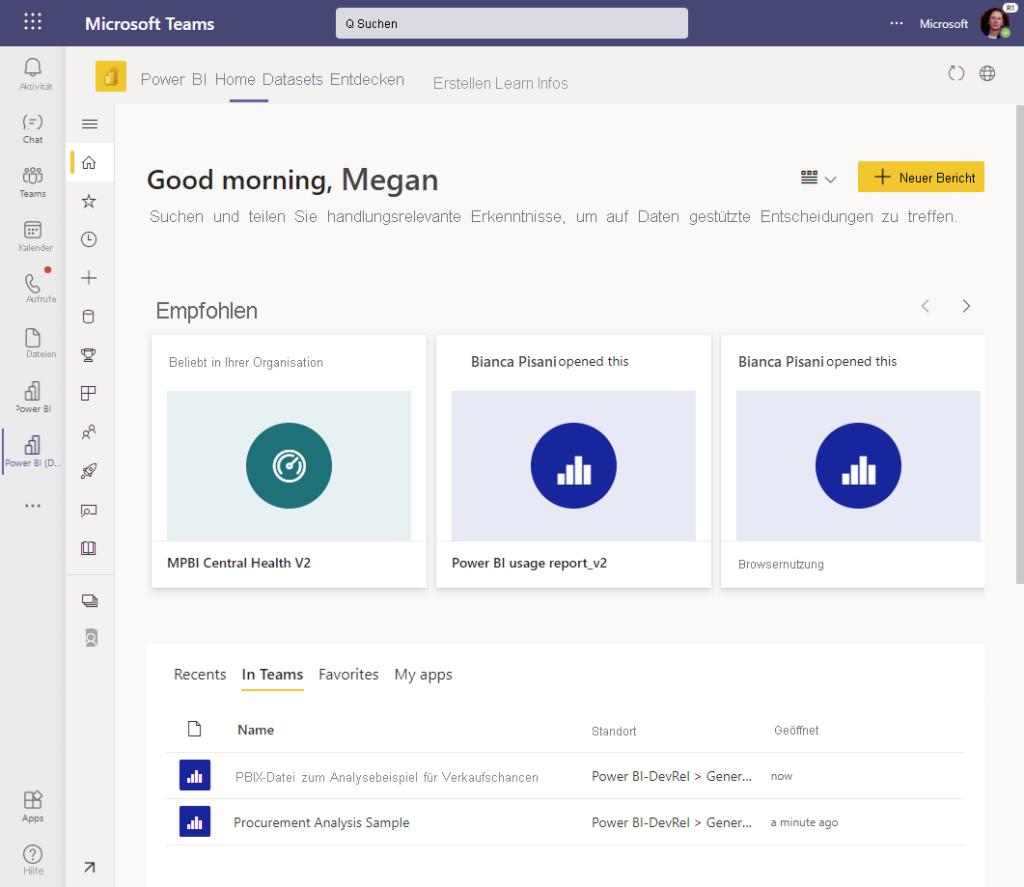
Display Power BI reports in Microsoft Teams
Share important charts directly with your team – during the running meeting. This will ensure that everyone sees what they are talking about and can work on it together. Avoid the confusing jumping back and forth between tabs and include the relevant reports directly in your call in Microsoft Teams. Access your Power BI files directly through the Teams interface. Immersive efficiency is simplified – and the focus of your meetings remains on the relevant content.
Integration of Power BI and Microsoft Dynamics 365
Power BI and Microsoft Dynamics 365 are growing ever closer together: Visualise your Microsoft Dynamics 365 data from the Power Platform, and use Power Apps applications directly in Dynamics 365 forms. Files and databases can also be used in both environments, provided they are properly linked. While Dynamics 365 offers a clearly structured interface, Power BI delivers advanced and intelligent analysis tools – the perfect combination.

More powerful AI
Artificial intelligence is already being used successfully in Microsoft products – it helps with the management and analysis of complex data sets, for example. The hype around ChatGPT shows that the end of development is far from being reached. One of the major innovations of this AI is that questions can be asked in natural language rather than with complicated commands and operators. Microsoft has invested in the ChatGPT company Open Ai and plans to integrate natural language commands into the Power Platform soon.
Instand graphics
The best figures are of no use if they cannot be presented well. Charts and reports were and are one of the greatest strengths of Power BI. However, the Microsoft developers noticed that not all users got along well with the user interface. As a result, a lot of time was lost – which can now be saved: The latest versions of Power BI make it possible to work directly in the graphics. Tools are used that most users are already familiar with from Microsoft’s Office programmes. This makes the visualisation process more immersive, faster – and more impressive in the final presentation.
Take advantage of the constantly improving Power BI! We will be happy to support you on your way – contact us!


